Over the years, I've simulated many (log normal) random walks in Excel. The joke has always been to show randomly generated paths to a 'chartist' and listen to them attempt to predict (with confidence) random future movement.
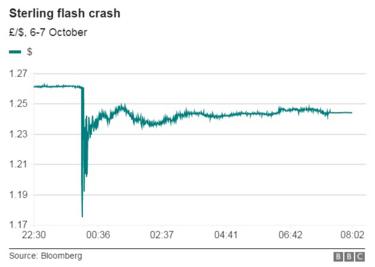
Sometimes though real price movement is very different to generated random walks. Take a look at the chart attached (ES 1h). This real price movement is hugely different to what we would reasonably expect from a random walk.
As a brainstorm, how would you quantify this as being different from a random walk? How would you detect this type of 'trending' movement?
This followed a period of low volatility.
Any ideas, no matter how obvious, would be valued.
Serving the Quantitative Finance Community

Re: Random Walks
A very simple technique is to write a function that converts paths like this into a numbers which represents some path feature. E.g. "fraction of consecutive movements in the same direction -which might be 80% of the 50 samples". Next, feed generated random walks through this function to get a statistical distribution of your feature which would be your "random walk" benchmark, e.g. it might say "50% +- 10%". You can then examine if the observed market path deviates from the random walk distribution (+3 stdevs).
However, it's never going to be conclusive, you can alway define feature that single out properties of a specific path that are either very normal or very exceptional,.. for any path... Before you know it you are a chartist tweaking your feature. E.g. Im not so sure that the example you gave is not random. I quite often throw triple 6 when I throw dices,.. or al least those are the throws that I remember!
The chart you gave gives rise to counter-joke as you've realised. "The joke has always been to show randomly picked historical market price moments to a 'quant' and watch them attempt to model it with the lognormal model, and then buy out of the money puts from them."

Re: Random Walks
Great comments from outrun, which I agree with. But ... just from a "pattern point of view", if we look at more of the move, there is a classic pattern I would call the "new equilibrium ringing bounce". You often see this in a stock after an earnings release or in the general market after a significant macro announcement. The market is searching for a new equilibrium (temporary, like all) and you get this kind of sinusoidal ringing pattern for a while. Of course, sometimes the bounce (in the earning release case) is due to comments in the conference call which follows the release. In the ES case, there were some comments by a Fed official that some news sources were attributing to part of the bounce back. Of course, the natural question is: what was the "news" that prompted the abrupt search for a new equilibrium? (N. Korea nuclear test?, September start of SAD?, [fill in your own answer here]) -- Beats me!

Re: Random Walks
Indeed! Many years ago our trading firm had an ring binder full of these "new equilibrium ringing bounce" plots! Every time I saw one I made a screenshot and printed it. The idea was inspired by a New Scientist article in 1993 about the "Prediction Company" that sought for "pockets of predictability" http://discovermagazine.com/1993/mar/ch ... wallstr185
-

- MartinGale7
- Posts: 70
- Joined:
Re: Random Walks
Great comments!
It feels a bit like being a bird-watcher or train-spotter, eagerly watching and taking pictures of recognizable occurrences. The hope is that after enough samples, and grouping like occurrences, you find some of these give an indicator of future market behavior. More examples usually make it easier to classify these.
Perhaps a measure of recent trendy-ness could be measured by the proportion of bars in a recent window where either
* a lower high was preceded by a bar with lower high, or
* a higher low was preceded by a bar with higher low.
In the above example, about 90-95% of bars satisfy this condition. In a random walk, you'd expect this to be about 50%.